Crypto market is in turmoil after the FTX exchange liquidity problems and bankruptcy. Many crypto investors are concerned more financial institutions will incur losses as waves of liquidity squeeze propagate through the system. They are actually pulling out their Bitcoin, Bitcoin SV and other crypto currencies from exchanges to keep them in their own custody to ride out this turbulence. This creates additional liquidity squeeze further pressuring Bitcoin price. Let’s see how Bitocin price changes and other factors will will answer to the question how to trade bitcoin in 2023?
Changes of Bitcoin Price in 2023
A straightforward bitcoin price prediction can be performed by conducting a technical analysis of the bitcoin price chart. Below is the weekly BTCUSD candle chart.
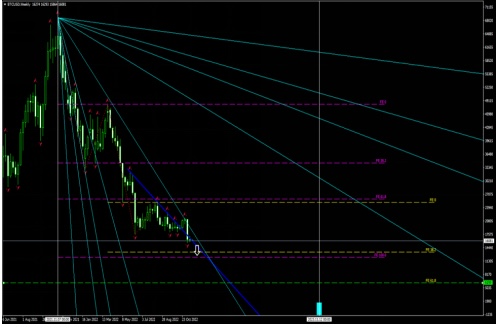
Chart 1: Weekly BTCUSD candle chart
The simple visual inspection of the BTCUSD weekly chart for bitcoin price prediction reveals Bitcoin price is in retreat after hitting all-time high about one year ago in mid-November of 2021. There were two attempts for downtrend reversal since then – in February and October of 2022, and both weren’t successful.
Six weeks ago bulls took over and Bitcoin price breached above resistance. However, the FTX debacle returned the control back to bears and price retraced below the resistance again. It looks the resistance will hold.
The Gann indicator gives another confirmation of downward Bitcoin price momentum. The Gann fan indicator shows Bitcoin price is retreating currently after testing the main downward 45 degree Gann aqua color line from below. The failure by Bitcoin price to breach that line is a clear indication that Bitcoin price is in downtrend.
The Fibonacci expansion indicator provides third confirmation of Bitcoin price downward momentum currently. The two Fibonacci expansion charts (in magneta and yellow) show the Bitcoin price is retreating after breaching eventually below the first support level at Fibonacci 61.8 around $25,767 and now is declining to test the Fibonacci 38.2 support at $13,400. A reversal in the downward momentum can be indicated if Bitcoin price bounces off that Fibonacci 38.2 support at $13,400 and breaches above both the resistance line and the main downward 45 degree Gann aqua color line. That would be a dramatic change in crypto market sentiment!
As it stands now, price is expected to decline. And bitcoin price prediction according to this chart is the Bitcoin price should be below $1450 by end of 2023!
Will Bitcoin Adoption Stay High in 2023?
Cryptocurrency adoption slowed considerably since the onset of the bear market this year but still remains above levels seen before 2021, according to a study by blockchain analysis firm Chainalysis. The report indicates that 18 of the 20 countries where crypto adoption was at its highest were low- to middle-income countries. Two uses dominated among the reasons for crypto adoption: cryptocurrency is used for sending remittances and protecting savings against high inflation.
Most likely bitcoin adoption will remain at roughly current levels in 2023. Two scenarios would entail rising bitcoin adoption rates: reversal of the crypto bear market and the increase in bitcoin adoption rate in low- to middle-income countries.
The global economy is expected to enter recession soon and chances of a reversal of the crypto bear market in recessionary conditions is not high.
And the likelihood of rising remittances in low to middle-income countries – which would drive bitcoin adoption higher – is not high under global recessionary conditions either.
So the best that can be hoped for bitcoin adoption is the maintenance of the current status quo.
How much will Bitcoin be worth in 2030?
The chart analysis can be used again for bitcoin price prediction 2030. This time we will use the BTCUSD monthly chart. Below is the monthly BTCUSD candle chart.
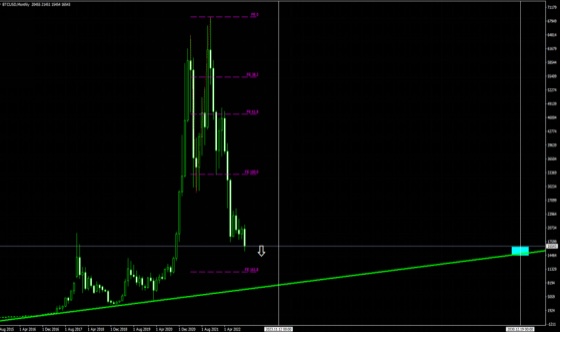
Chart 2: Monthly BTCUSD candle chart
The visual inspection of the BTCUSD monthly chart for 2030 Bitcoin price prediction reveals Bitcoin price is retracing down toward the support after hitting all-time high in November of 2021. The Fibonacci expansion indicator (in magneta) shows the Bitcoin price is retreating to test the Fibonacci 161.8 support at $10,660. A possible breach below Fibonacci 161.8 support will take price close to long term support line. This line is likely to hold – so the 2030 Bitcoin price prediction is the range $14,500-$16,500 around that support level.
Regulations That Can Affect Crypto Market in 2023
The United States is in process of formulating the broad framework for cryptocurrency regulation as lawmakers decide whether cryptocurrencies are securities like equities or commodities like gold. There is a broad agreement investment in Bitcoin and cryptocurrencies will increase as retail clients feel safer with regulatory protections.
And the European Union has finally agreed on a unified licencing regime which will regulate crypto exchanges including Binance and Coinbase. Once everything is finalized all exchanges will be able to operate across the borders of the 27-member union of states within its Crypto Regulation Framework.